Health AI SaaS · 03 / 11 · mobile application
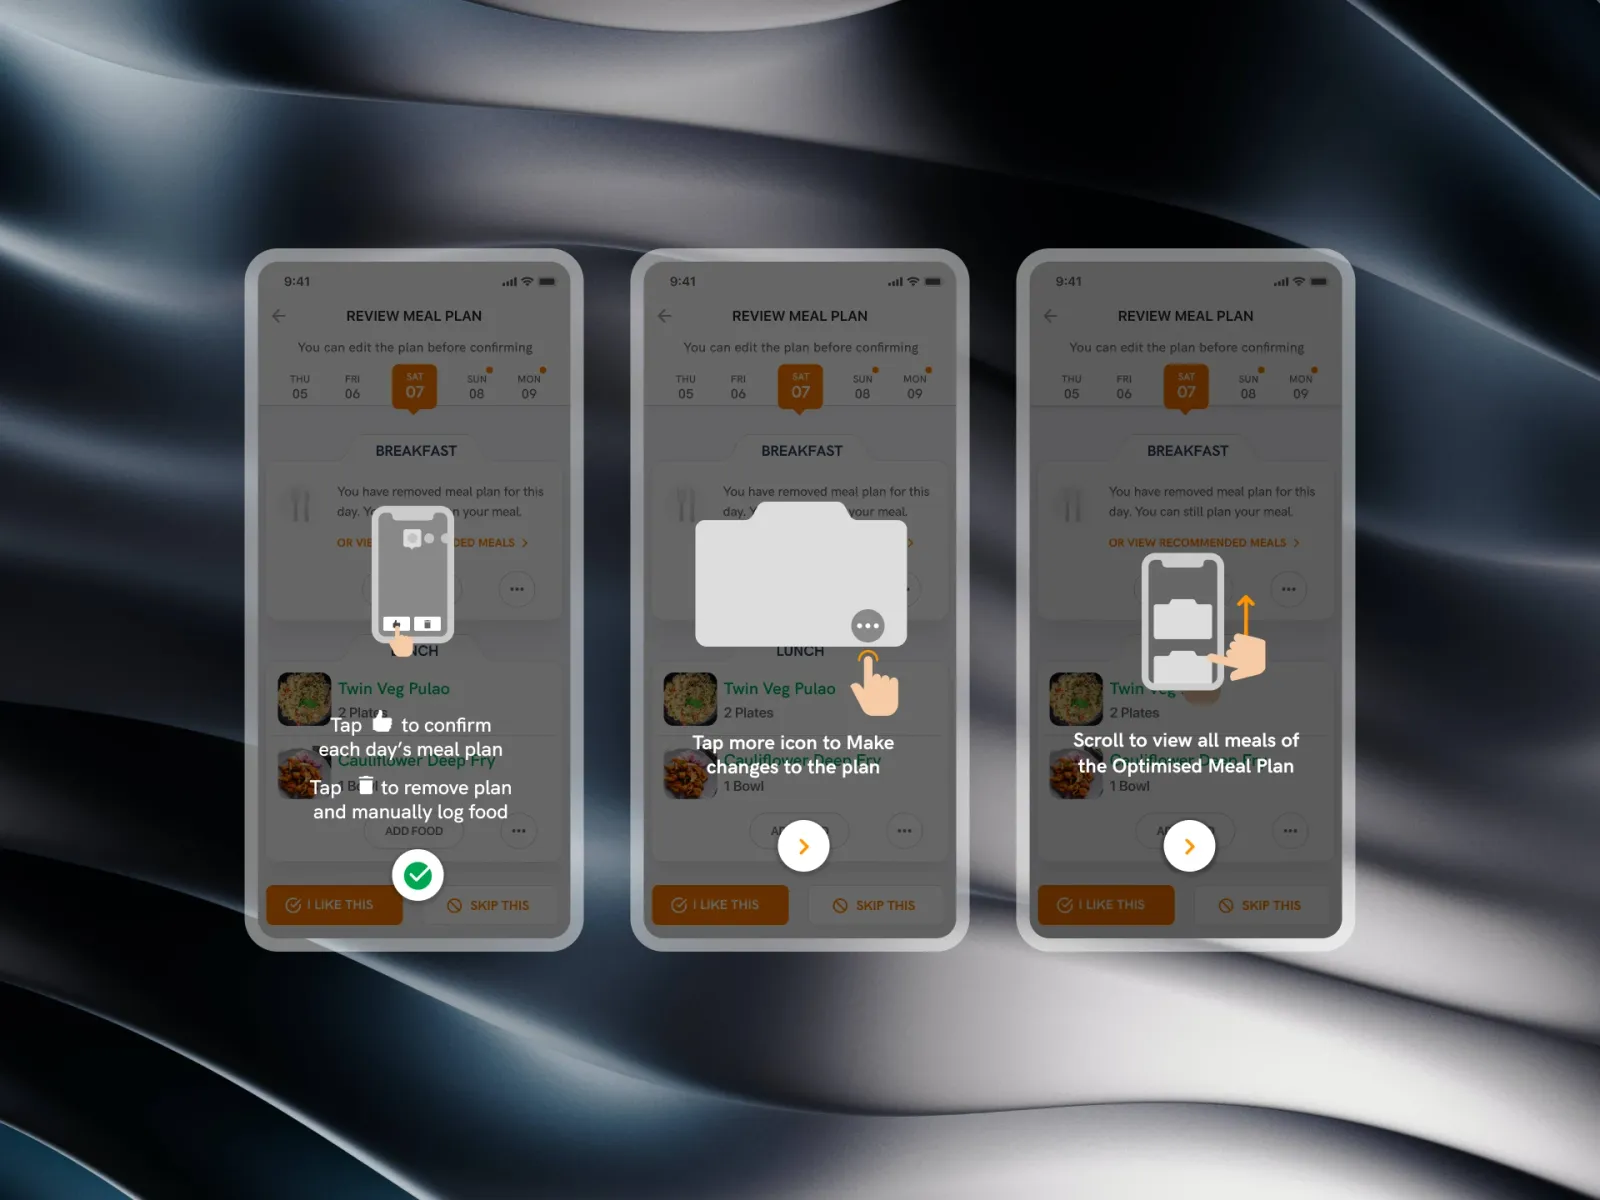
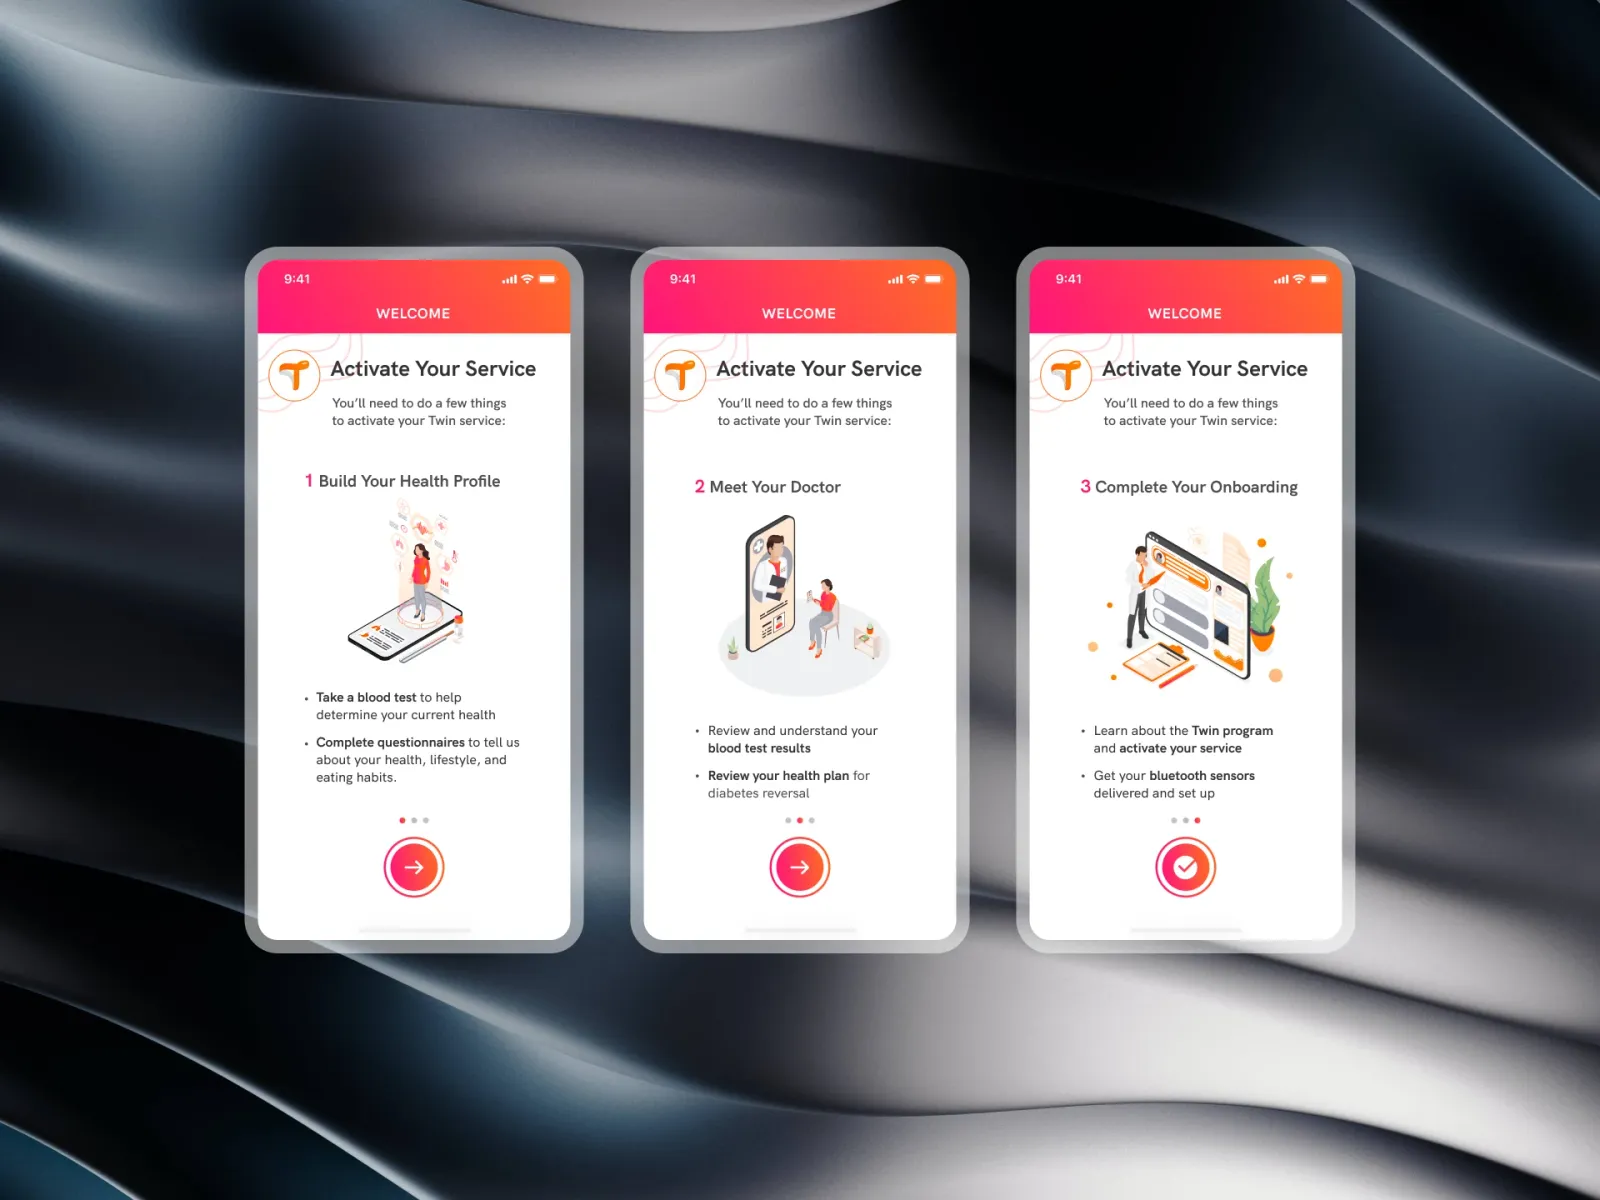
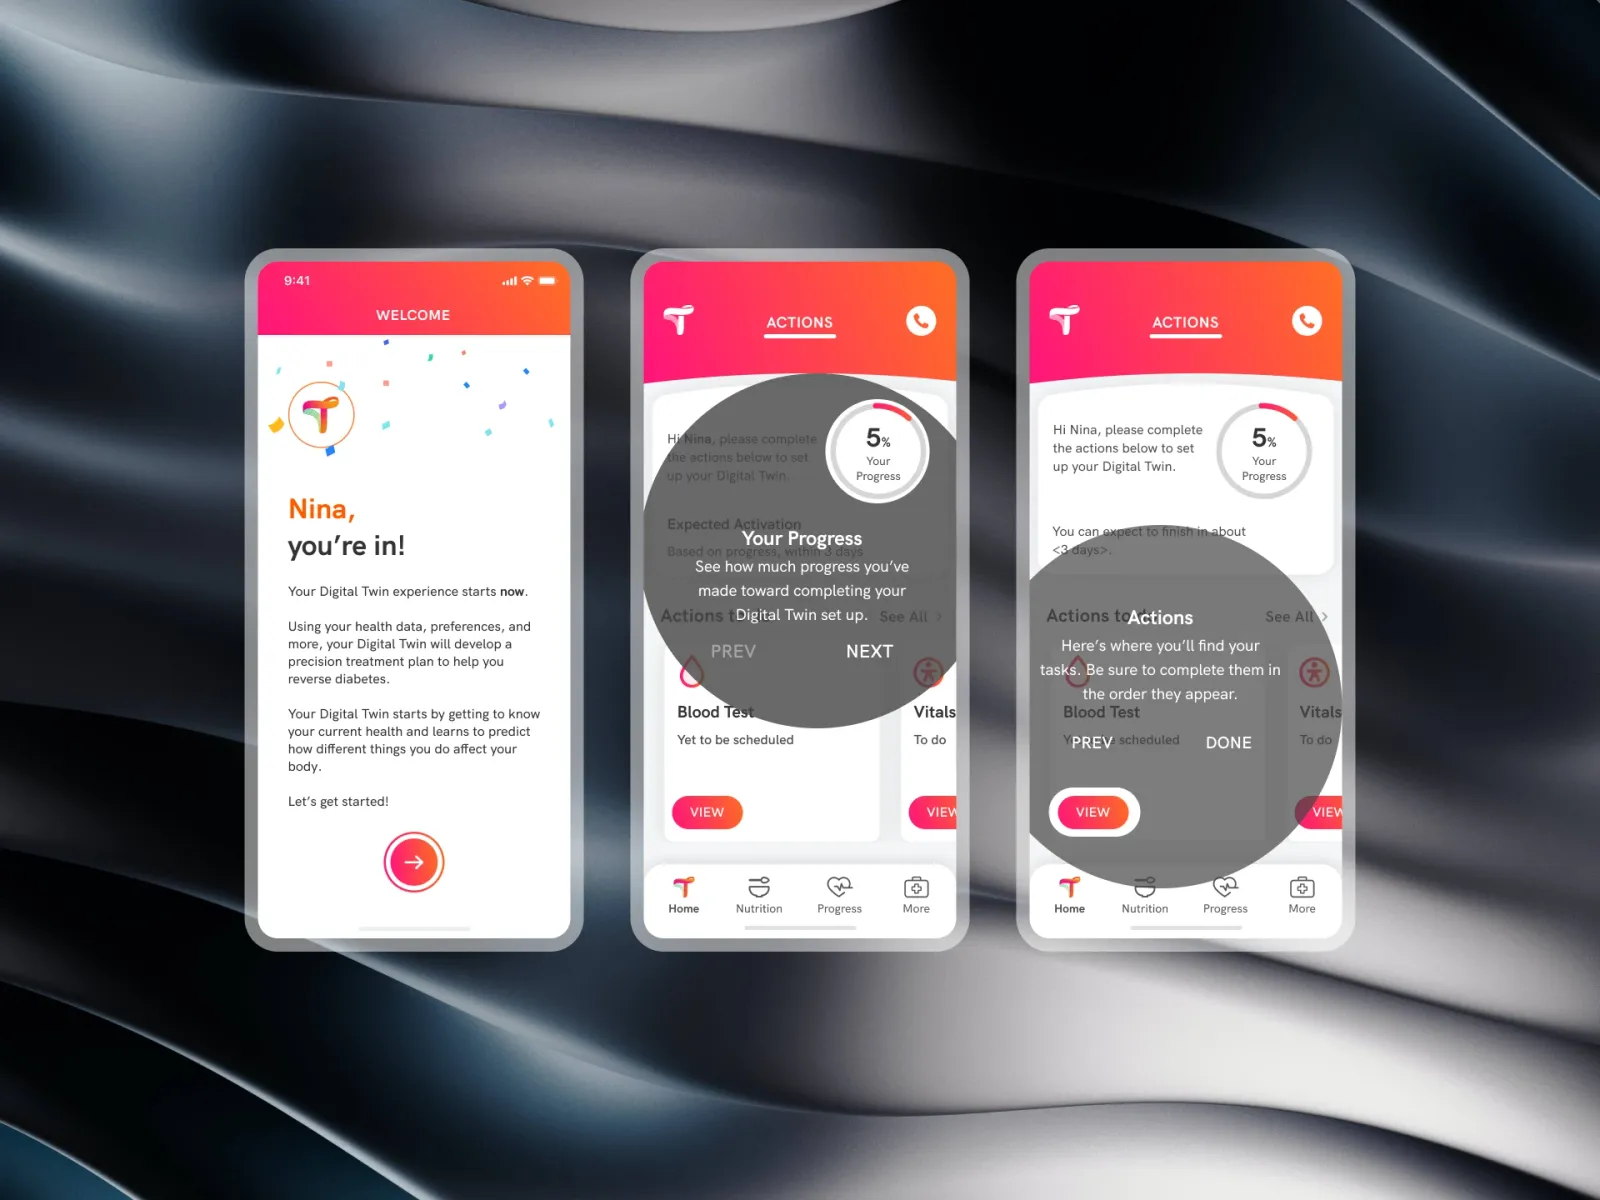
Onboarding coach marks
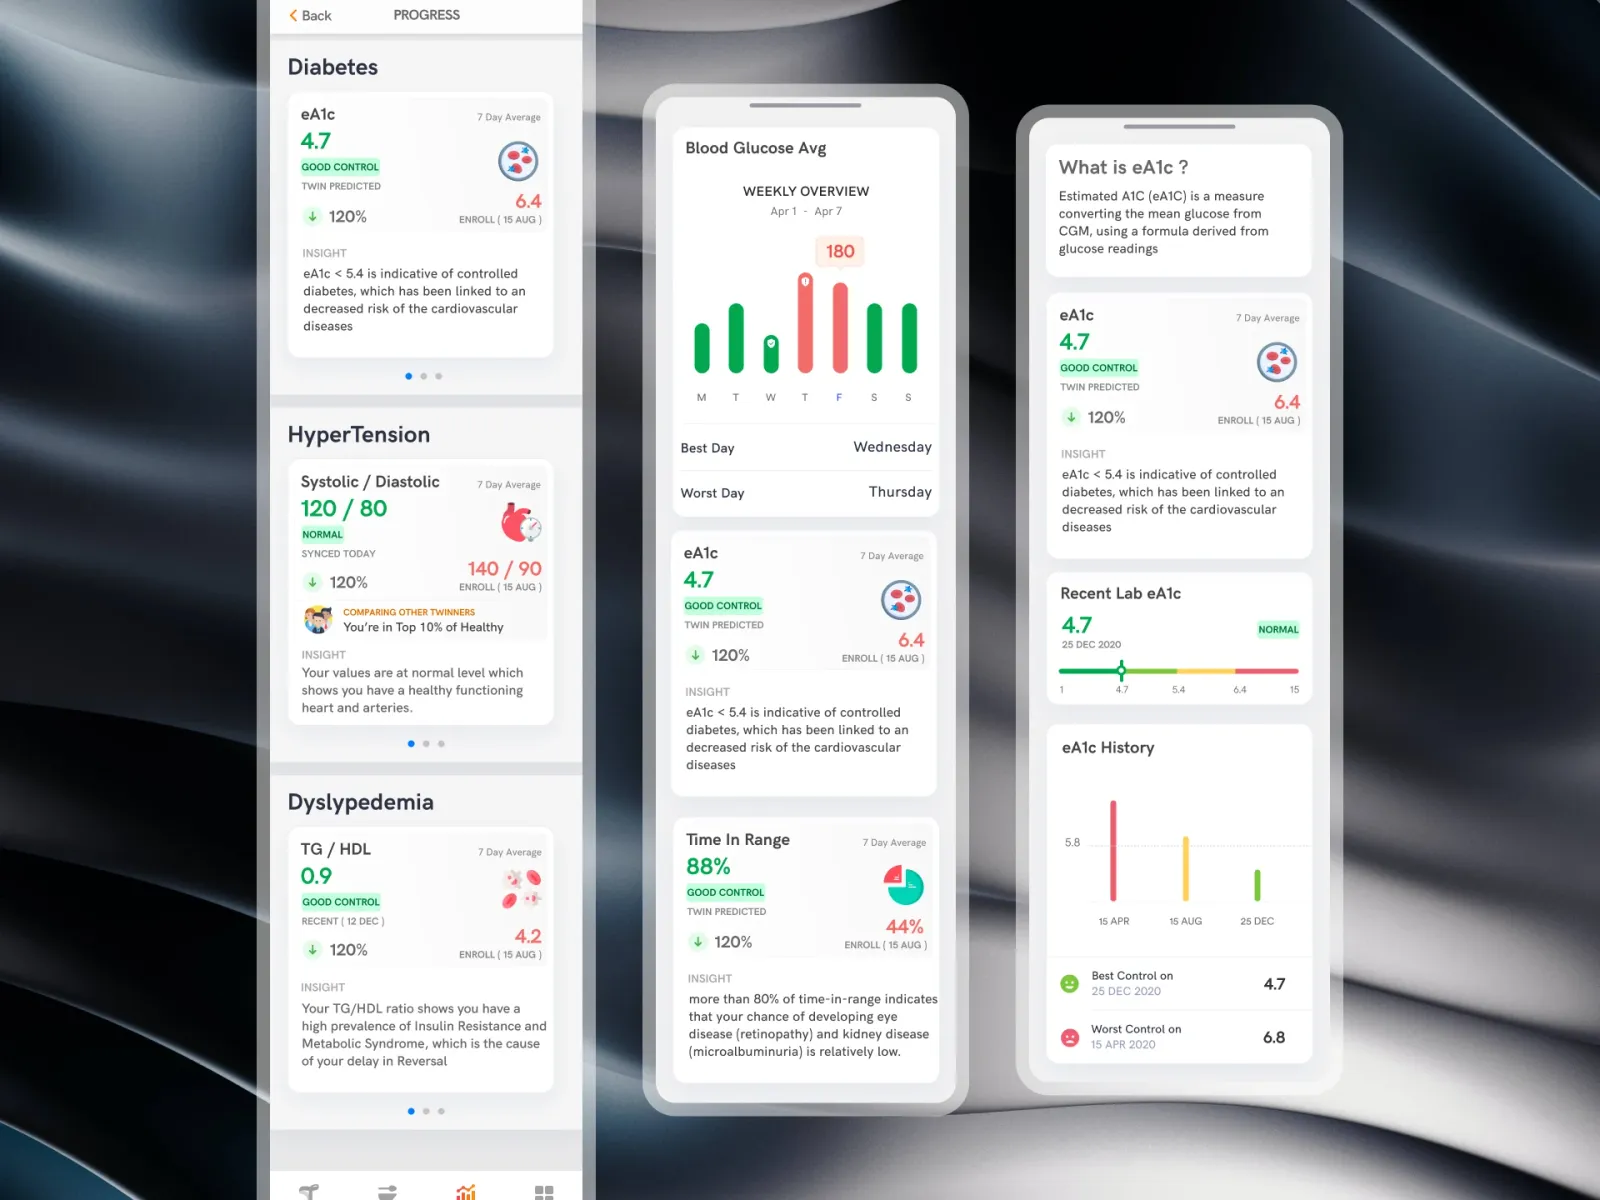
A progress screen that shows members their eA1c, blood pressure and cholesterol against where they started — and teaches what each number means once.
Overview
Once a member is wearing sensors, the app starts showing them numbers most people have never been asked to read: estimated A1c, blood pressure, a triglyceride-to-HDL ratio, time in range. This is the progress screen that shows them, and the coach marks that teach a member what each one means the first time they see it.
The problem: Without context, a TG/HDL ratio of 4.2 or a reading of 180 mg/dL produces either panic or a shrug. Traditional medical charts show the number and stop — no starting point, no benchmark, no idea what to do about it.
What we built: One card per condition — diabetes, blood pressure, cholesterol — each showing the number beside where the member started and a verdict in words. A short tour lights one card at a time on first open. After the tour the explanations don't disappear: each card keeps a "?" that opens the full explainer, with the scale and the member's own history on it.
Who it's for:
- Primarily: members tracking their progress across diabetes, hypertension and dyslipidemia.
- Also: health coaches who refer to the same screen on their weekly calls.
Your progress
4.7eA1c · 7-day
6.4 when you joinedGood control
eA1c estimates your HbA1c from your sensor's readings. Under 5.4 means your diabetes is under control.
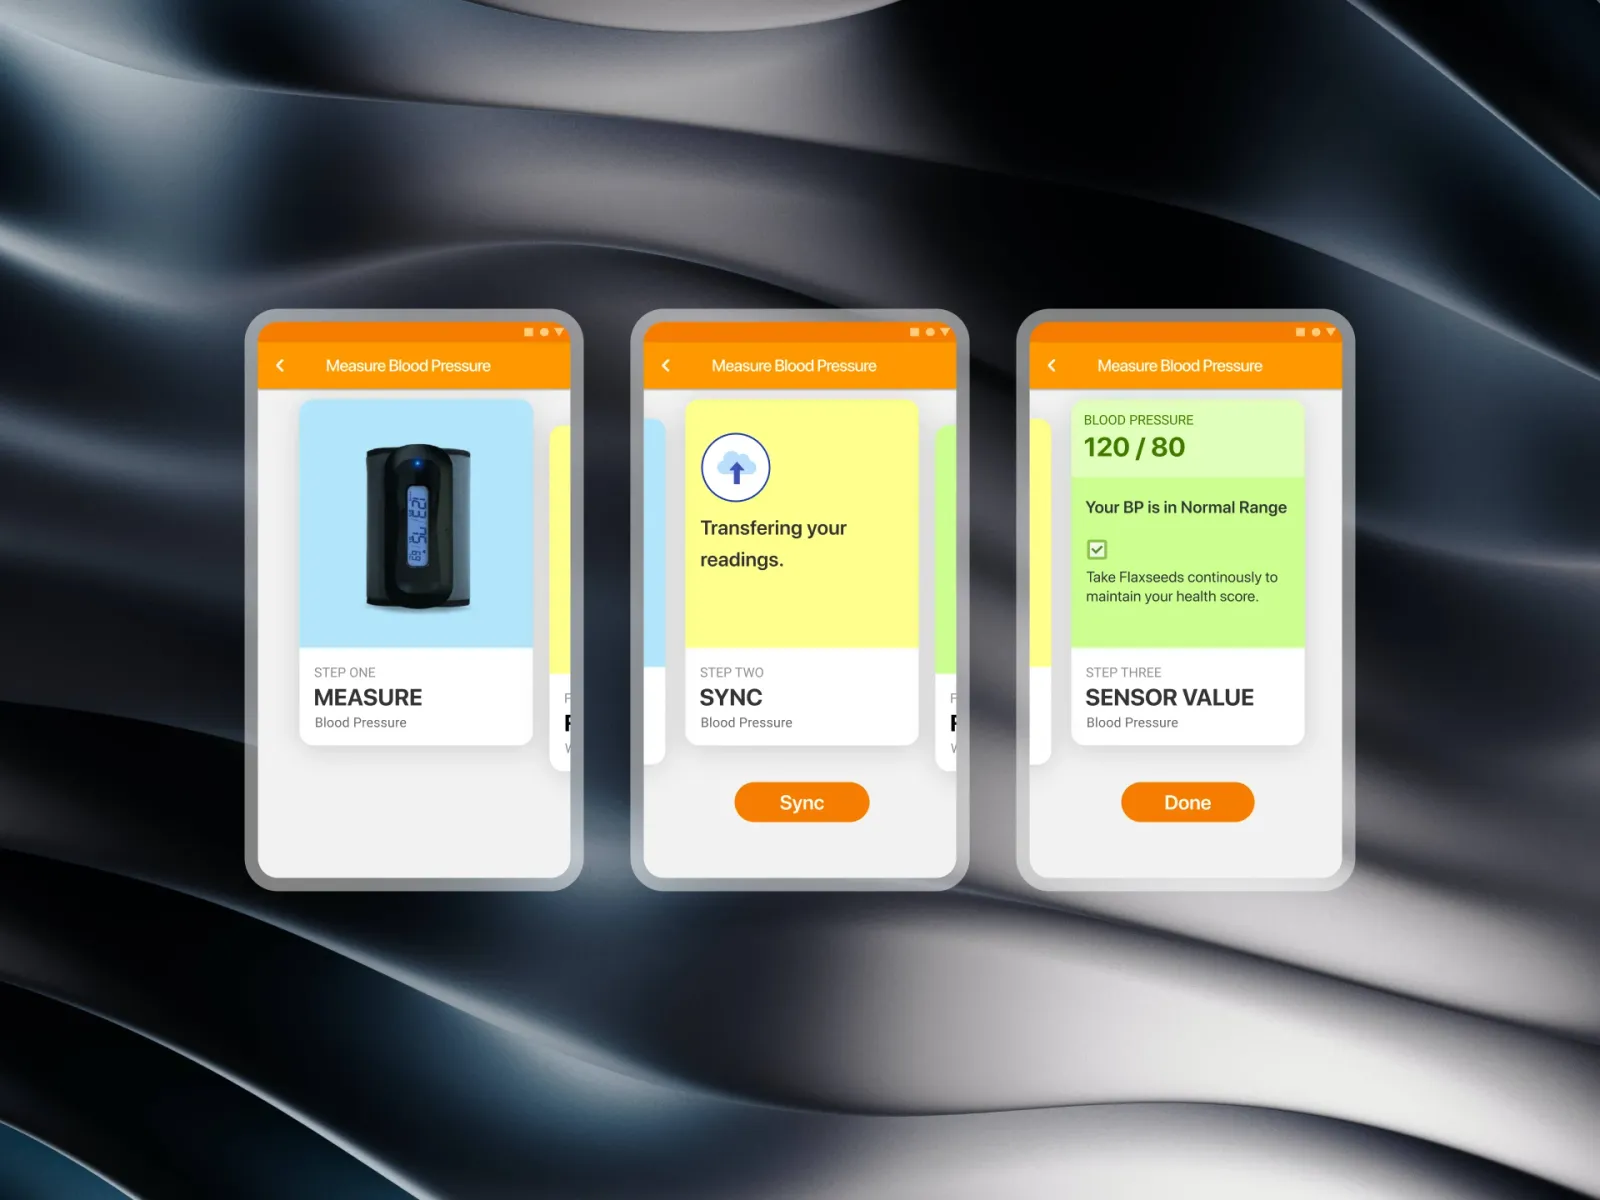
120/80mmHg · today
140/90 when you joinedNormal
0.9TG/HDL · 12 Dec
4.2 when you joinedGood control
Best: WednesdayWorst: Friday, 180
When the explanations appear
The prototype above is the screen on first open. Follow the tour, then tap the "?" on the Diabetes card.
The rules we settled on:
- Once, then on request. The tour runs on first open only. A tip that comes back every day is a pop-up, not a teacher.
- One card at a time. Everything else dims, so there's only one thing to read.
- Skippable everywhere, with nothing lost: the "?" on each card holds the same words.
- Short. One sentence per tip. The detail lives in the explainer for whoever wants it.
The questions we had to answer
- What is eA1c, compared to the HbA1c from a blood test?
- Encouragement or honesty? Celebrate a drop from 6.4 to 4.7 without hiding the evening spikes.
- Three conditions at once, without three times the worry.
- When should a tip appear so it teaches without getting in the way of a daily check-in?
Every card says the same four things
- Diabetes: eA1c 4.7 (seven-day average), Good control, against 6.4 at enrolment — "An eA1c under 5.4 indicates controlled diabetes, which is linked to a lower risk of heart disease."
- Blood pressure: 120/80, Normal, against 140/90 at enrolment, with "You're in the top 10% of members" as a gentle benchmark.
- Cholesterol: TG/HDL 0.9, Good control, against 4.2 at enrolment, explained as a marker of insulin resistance.
The verdict is always written out, never only a colour, so it reads the same to a screen reader and to someone who can't tell green from amber.
The week
A Monday-to-Sunday bar chart picks out the spike days and names the best and worst — "Best day: Wednesday" — to prompt the question what was different? Beside it, time in range: 88%, up from 44% at enrolment.
The explainer
Tapping "?" opens the full sheet:
- A definition: "Estimated A1c turns the average of your sensor readings into the same scale as a lab HbA1c test."
- The scale: 1 to 15 in three bands — under 5.4, 5.4–6.4, over 6.4 — with the member marked on it.
- History: 6.8 in April, 5.8 in August, 4.7 in December, and "Best so far: 4.7."
Results
- Understanding: after two weeks, about two thirds of surveyed members could explain their eA1c and time in range — up from about a third.
- Retention: 60-day app retention rose by about six points.
- Outcomes: members who opened the explainers often had slightly larger HbA1c drops over six months. Encouraging — but it doesn't show the explainers caused it.
Conclusion
The numbers didn't get simpler. Putting each beside its starting point, saying what it means in one sentence, and keeping the full explanation one tap away turned a page of lab values into something members could read — and talk about with their coach.
Gallery
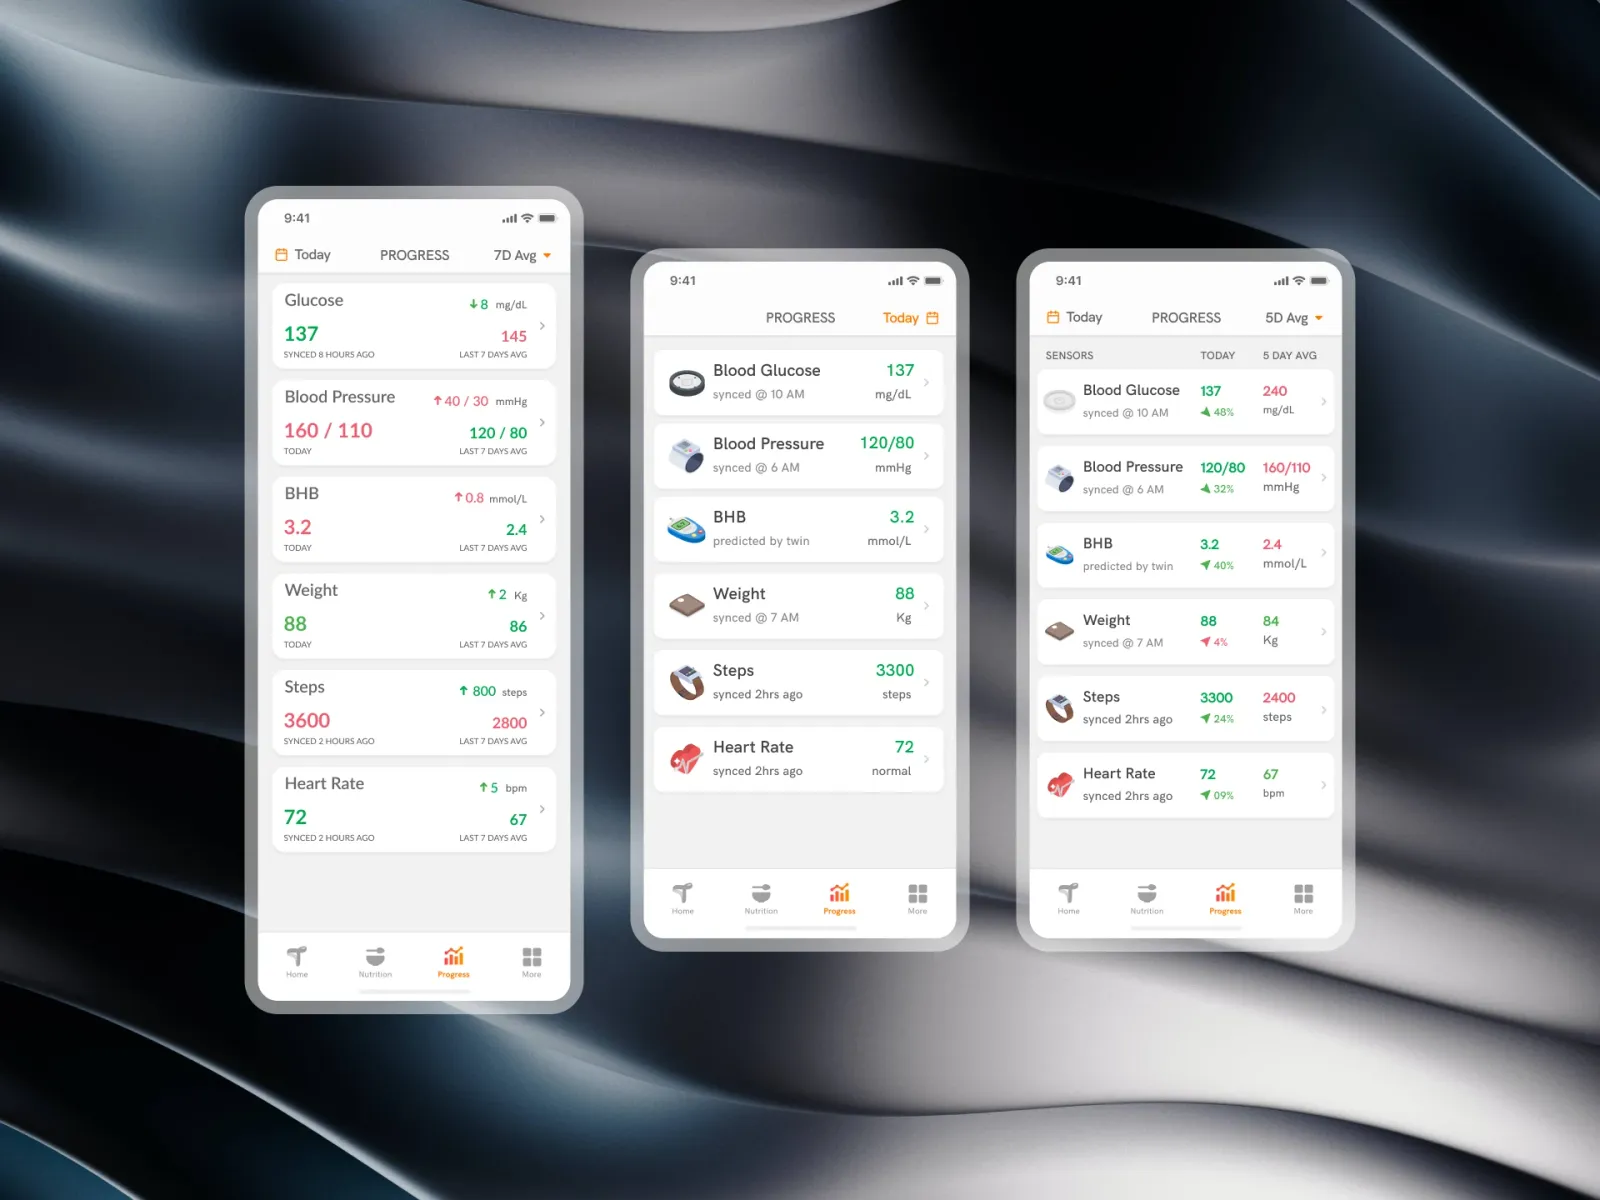
01 / 30Progress — Diabetes (eA1c 4.7), blood pressure (120/80) and cholesterol (TG/HDL 0.9), each against where the member started.